
CCOR - Cs/Cc/B3 corrector for TEM (achroplanatic)
CCOR - Cs/Cc + off-axial coma corrector for TEM (achroplanatic)
The CCOR Cc/Cs-corrector for transmission electron microscopy (TEM) was developed within the TEAM project to enable a resolution of only 0.5 Angström (0.05 nm) in TEM. The CCOR is a quadrupole-octupole-type corrector which corrects for the third order spherical aberration Cs=C3 and the off-axial coma B3 and, moreover, removes the linear chromatic aberration Cc. The correction of Cc requires not only magnetic multipole fields but also very strong electrostatic quadrupole elements (up to +/- 8kV). CEOS is the only company world-wide, which successfully applies this elaborate technology for aberration correction in TEM. The optical design of the CCOR enables complete axial aberration correction of the 4th order and partial correction of the 5th order. Moreover, all off-axial aberrations up to including 3rd order can be corrected (aplanatic imaging). The residual chromatic aberrations are so small that a large energy window of about 1 keV can be imaged with hardly any defocus variations (achromatic imaging). Because of these properties, the CCOR is a so-called Achroplanat. The correction of the chromatic aberration Cc does not only considerably improve the TEM's information limit (resolving power), but also enables a much higher image contrast due to the additional contrast contribution of inelastically scattered electrons which otherwise only form a blurred image background in Cc-uncorrected images. Therefore, in materials science the CCOR opens up new applications in the context of energy-filtered TEM imaging (EFTEM) and electron energy loss spectroscopy (EELS), and is especially useful for investigations on thick object structures. In life sciences, the CCOR is especially advantageous for cryo electron microscopy (cryoEM) and cryo tomography where intense inelastic scattering occurs due to high sample thickness and high sample tilt. The CCOR manages that those electrons still largely contribute to the image contrast.
Features:
- Quadrupol-octupol type corrector for TEM
- Simultanious correction of the chromatic aberration Cc, the spherical aberration Cs=C3 and the off-axial coma B3
- Adjustable for high tensions from 50 kV up to 300 kV
- Corrects all axial aberrations up to 5th order(C1, A1, B2, A2, C3, S3, A3, B4, D4, A4, S5, R5).
- Corrects off-axial aberrations up to 3rd order(A1g/G, A2g/G, B2g/G) for large fields of view, e.g. with a 4kx4k-camera
- Compared to the use of a monochromator for resolution improvment Cc correction offers a much more intense electron beam at the same or better image resolution and therefore allows much shorter exposure times hence higher throughput.
- Higher image contrast due to additional high-resolution contrast contribution from inelastically scattered electrons by Cc correction.
- Compatible with the following TEMs:TFS Titan, others on request
Specifications:
- Device dimensions: 638 x 638 x 829 [mm]
- Mode: TEM (Cryo-TEM)
- High voltage range: 50kV – 300kV
Applications :
- In materials science especially useful for ultra-high resolution TEM and spectroscopic imaging (EFTEM).
- In life sciences especially useful for cryo-TEM and cryo-tomography of thick samples, e.g. whole cells.
Contact
Do you have any questions about the product or the application and extension for your e-beam system? Please contact us at info@ceos-gmbh.de
Diffractogram (left) and Young's fringe pattern (right) of gold particles, imaged with an TFS Titan with CCOR at 50 kV. Both images show reflectionsat 11.1 /nm. Therefore, the information limit at 50 kV reaches at least 90 pm. The enlarged diffractogram at the left side even shows Au [422] reflections, which correspond to a spacing of only 83 pm. (PICO Status Report 2014)
a) Atomic resolution phase contrast image of YAIO_3:Ce (YAP), recorded in the chromatic and spherical aberration-corrected PICO electron microscope with CCOR at 200 kV. The yttrium atom pairs, the O-Al-O connections and the isolated oxygen atoms are all spatially resolved. b) The distribution of atom-pair separations as evaluated from the TEM image reveals that the Y-Y distances are not constant. Atomic displacements occur due to relaxations which are attributed to the small thickness of the very thin TEM sample. c) Two representative line profiles show the atomic Y-Y distances of 68 pm and 57 pm, respectively. d) The schematic representation of 2x2 orthorombic unit cells along the crystallographic b-axis of YAP illustrates the ideal (bulk) atomic distances. (L Jin, J. Bartel, C Jia and K.W. Urban Ultramicroscopy 176 (2017) 99-104).
Tilt series for tomography of a whole macrophage cell, imaged with a chromatically and spherically corrected transmission electron microscope at 300 kV, with semi aperture 10° and pixel size 4.53 nm (TFS Titan 80-300 „PICO“, PICO project, Er-C, Jülich, Germany). a) TEM image at 0° tilt angle showing "low-density Lipoprotein" (LDL) coated gold nano particle clusters inside the cell. b) 3D reconstruction of the cell. Three slices (with 154 nm thickness) inside the volume along the height are pictured. c) 3D model of the tomogram shown in b). Clustered nano particles are pictured in green. The plasma membrane curls are imaged in purple. (Baudoin et al. Microsc. Microanal. 19, 814-820, 2013).
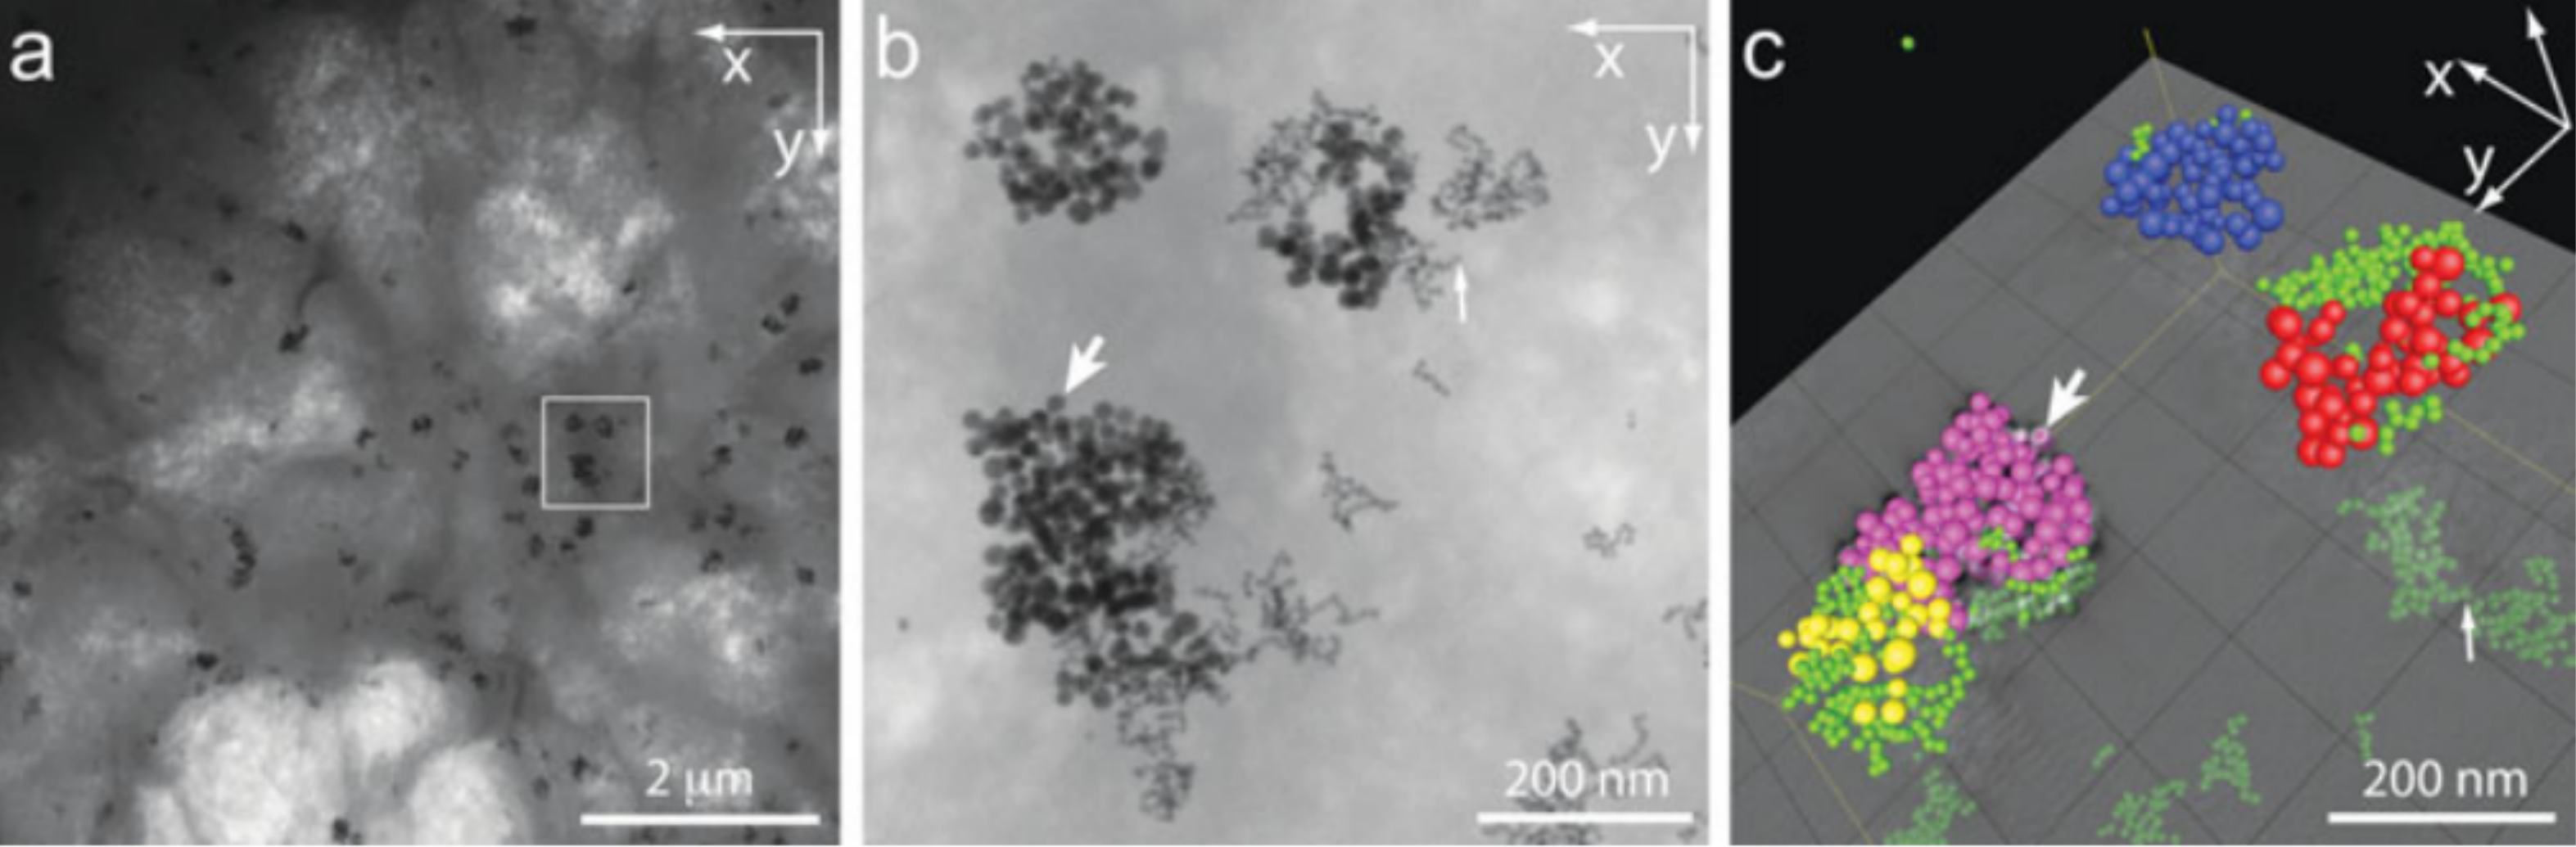
3D reconstruction of gold nano particle clusters inside a macrophage cell, imaged with a chromatically and spherically corrected transmission electron microscope at 300 kV (TFS Titan 80-300 „PICO“, PICO project, Er-C, Jülich, Germany). a) Cell overview at 3.39 nm pixel size. b) White box area marked in a), imaged at 0.44 nm pixel size. Nano particle clusters of different sizes are visible. c) 3D reconstruction of individual nano particles imaged in b). Nano particles with 7 nm diameter are marked in green. Nano particles with 16 nm diameter are marked in magenta, yellow, red and blue. The white arrows in b) and c) point to the same nano particle respectively. (Baudoin et al. Microsc. Microanal. 19, 814-820, 2013).
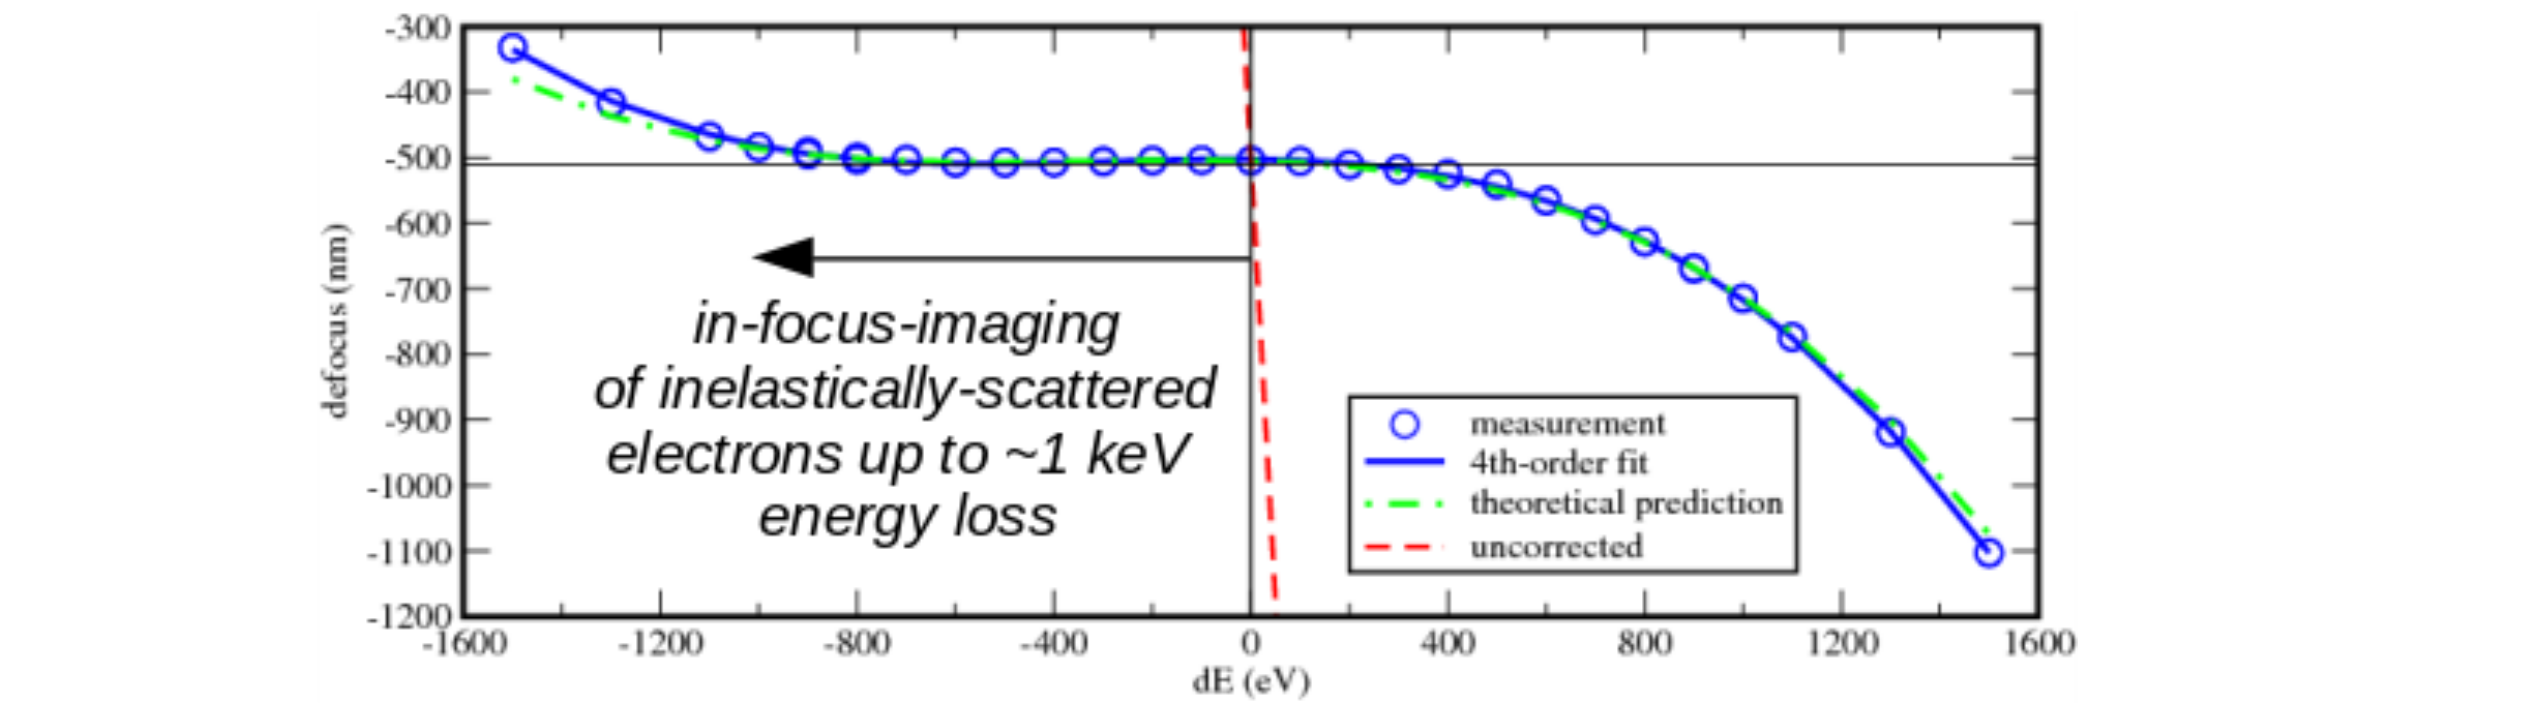
After successful correction of the linear chromatic aberration Cc the achromaticity is only affected by higher order chromatic aberration coefficients. Those, however, are so small that they are negligible compared to a Cc-uncorrected microscope (red dashed line). Consequently, all electrons in a very large energy window (~1 keV) are equally well focussed on the camera. This greatly improves general image contrast. Moreover, it enables high-resolution EFTEM images with large energy windows.